Introduction:
In our fast-moving digital landscape, grabbing attention quickly has become essential. Infographics offer an impactful way to translate complex information into appealing and easy-to-understand visuals. Whether you’re an entrepreneur, marketer, teacher, or student, learning to design Infographic designing made simple can significantly enhance your communication skills. The best part? You don’t need to be a design expert to create impressive visuals. With the right tools and a bit of guidance, crafting infographics can be straightforward and enjoyable. This article will guide you through the core principles of effective infographic design.
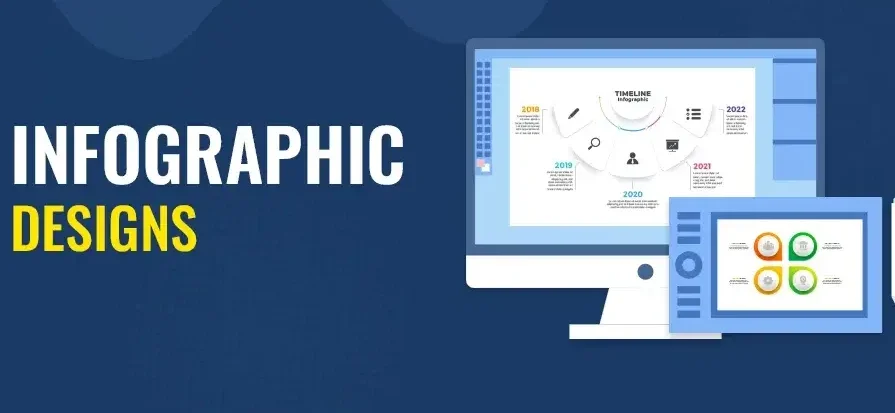
What is an Infographic?
An infographic is a graphic tool that illustrates data, facts, or ideas by merging visuals, text, icons, and charts for quick, clear understanding. Instead of overwhelming readers with paragraphs, an infographic breaks down key points into digestible, visually appealing chunks.
Infographics can serve many purposes:
- Educate audiences on a topic
- Summarize reports or research
- Promote products or services
- Drive traffic and shares on social media
- Enhance branding and professionalism
Why Use Infographics?
Infographics are a powerful way to communicate information visually, making complex data easy to understand at a glance. They boost engagement, enhance retention, and are highly shareable across digital platforms. Using infographics can simplify your message while capturing your audience’s attention more effectively.
- Easy to Understand: Visuals simplify complex ideas.
- Highly Shareable: Perfect for social media and blogs.
- Boost Engagement: Readers spend more time interacting with visual content.
- Improve Retention: People remember visuals better than text.
- Enhance SEO: Infographics attract backlinks and increase visibility.
Simply put, an infographic is one of the most effective tools to make your message stick.
Step-by-Step Guide to Creating an Infographic
1. Define the Goal and Audience:
Before opening any design software, ask:
- What is the purpose of this infographic?
- Who is the target audience?
- What action do I want them to take?
For example, if your goal is to explain the benefits of organic food to busy moms, your tone should be friendly, and your visuals should be bright and clear. But if you’re presenting a quarterly business report to executives, your design should be sleek and professional.
2. Collect and Organize Your Data:
An infographic’s effectiveness relies entirely on the quality and accuracy of the information it conveys. Ensure your data is:
- Accurate
- Up-to-date
- Relevant
- Credible
Use reliable sources and organize your content into key points or sections. Create an outline to ensure your narrative flows logically from beginning to end.
3. Choose the Right Type of Infographic:
Depending on your message, different types of infographics work better:
- Statistical: Great for surveys, research, and trends
- Timeline: Best for showcasing history or progress
- Process: Explains how something works step-by-step
- Comparison: Compares two or more items
- Geographic: Visualizes data by location
- Hierarchical: Organizes data by importance or structure
- Informational: Provides general knowledge on a topic
Selecting the right format helps communicate your message more effectively.
4. Sketch a Wireframe:
Before jumping into design tools, sketch a rough layout on paper or a whiteboard. Map out:
- Header
- Sections or data blocks
- Icons or images
- Graphs or charts
- Call to action (if needed)
This blueprint saves time and keeps your design process organized.
5. Design Essentials: Keep It Simple and Visual:
Use a Grid: A grid helps align elements and maintain balance. Keep spacing consistent and layouts symmetrical unless you’re intentionally going for an abstract design.
Limit Your Color Palette: Stick to 2–4 colors to maintain consistency. Use brand colors if applicable. Platforms like Coolors are great for creating balanced and complementary color schemes.
Typography Matters: Use no more than two different fonts—typically one for headings and one for body text. Ensure readability across all devices.
Use Icons and Illustrations: Icons can replace blocks of text and make concepts easier to understand. Sites like Flaticon and Iconscout are great resources.
Visualize Data with Charts: Use bar charts, pie charts, or line graphs to show numbers. But avoid clutter—don’t add a chart unless it adds value.
6. Choose the Right Tools:
You don’t need to be a Photoshop expert to design a stunning infographic. Here are some beginner-friendly tools:
Canva: Drag-and-drop with hundreds of templates
Piktochart: Great for data-focused infographics
Venngage: Business-focused templates with easy customization
Adobe Express: Adobe Express offers a user-friendly interface with robust features, seamlessly integrating with Adobe Creative Cloud for enhanced design flexibility.
For experienced designers, software like Adobe Illustrator or Figma provides greater flexibility and advanced customization options.
7. Maintain Visual Hierarchy:
Design isn’t just about aesthetics—it’s also about guiding the viewer’s eye. Leverage size, color, and spacing to highlight key elements and guide the viewer’s focus.
Headline: Big and bold
Section Titles: Smaller but prominent
Body Text: Clean and readable
Data Highlights: Use contrasting colors or bold fonts
This structure ensures viewers understand your message in the order you intend.
8. Review and Revise:
Always double-check:
- Spelling and grammar
- Data accuracy
- Alignment and spacing
- Overall balance
Ask a colleague or friend for feedback. Having someone else review your work can help spot errors you might have missed.
9. Optimize for Different Platforms:
Export your infographic in the right format for where it will be shared:
PNG/JPG: Great for websites and social media
PDF: Ideal for printing or email attachments
Interactive HTML: Perfect for embedding on websites
If sharing on Instagram or Pinterest, design with platform dimensions in mind. A vertical format typically performs best on social platforms.
10. Track and Learn:
If you’re using your infographic for marketing or educational outreach, track how it performs:
- How many shares or likes did it get?
- Did traffic increase?
- Are people spending more time on your page?
These insights will help you refine your approach for the next design.
Bonus Tips for Better Infographic Design
Tell a Story: Even data becomes engaging when framed as a story.
Add a CTA: Don’t forget to tell viewers what to do next—download a guide, share the post, visit your website.
Use White Space Wisely: Crowding your design overwhelms the viewer. Let it breathe.
Stay On-Brand: Use your company’s color scheme, fonts, and tone to maintain consistency.
Conclusion:
Infographic design doesn’t have to be intimidating. With clear goals, good data, and the right tools, anyone can create professional and eye-catching infographics. Whether you’re simplifying a complex idea, promoting your brand, or trying to stand out in a content-heavy space, infographics are a versatile and powerful tool.
So grab a sketchpad, pick a template, and start turning your ideas into visuals. With practice and creativity, infographic design will become second nature—and your audience will thank you for it.
Also Read: Mastering Typography in Designs